> ## Documentation Index
> Fetch the complete documentation index at: https://docs.browserbase.com/llms.txt
> Use this file to discover all available pages before exploring further.
# Observability
> Debug and monitor your browser sessions with logs, metrics, and real-time inspection
Watch and interact with browser sessions in real-time as they run.
Replay every session as a video recording to debug issues after the fact.
Stream session replays as HLS to embed playback in your own application.
Browserbase provides comprehensive observability tools to debug and monitor your browser sessions. Access these tools through the Session Inspector in the Dashboard or retrieve data programmatically via the API.
The Session Inspector is accessible by clicking any session in the [Dashboard](https://www.browserbase.com/sessions).
## Dashboard
### Video recordings
Every session is automatically captured as a video recording, supporting up to 10 tabs. Video recordings are available in the Session Inspector for playback and debugging.
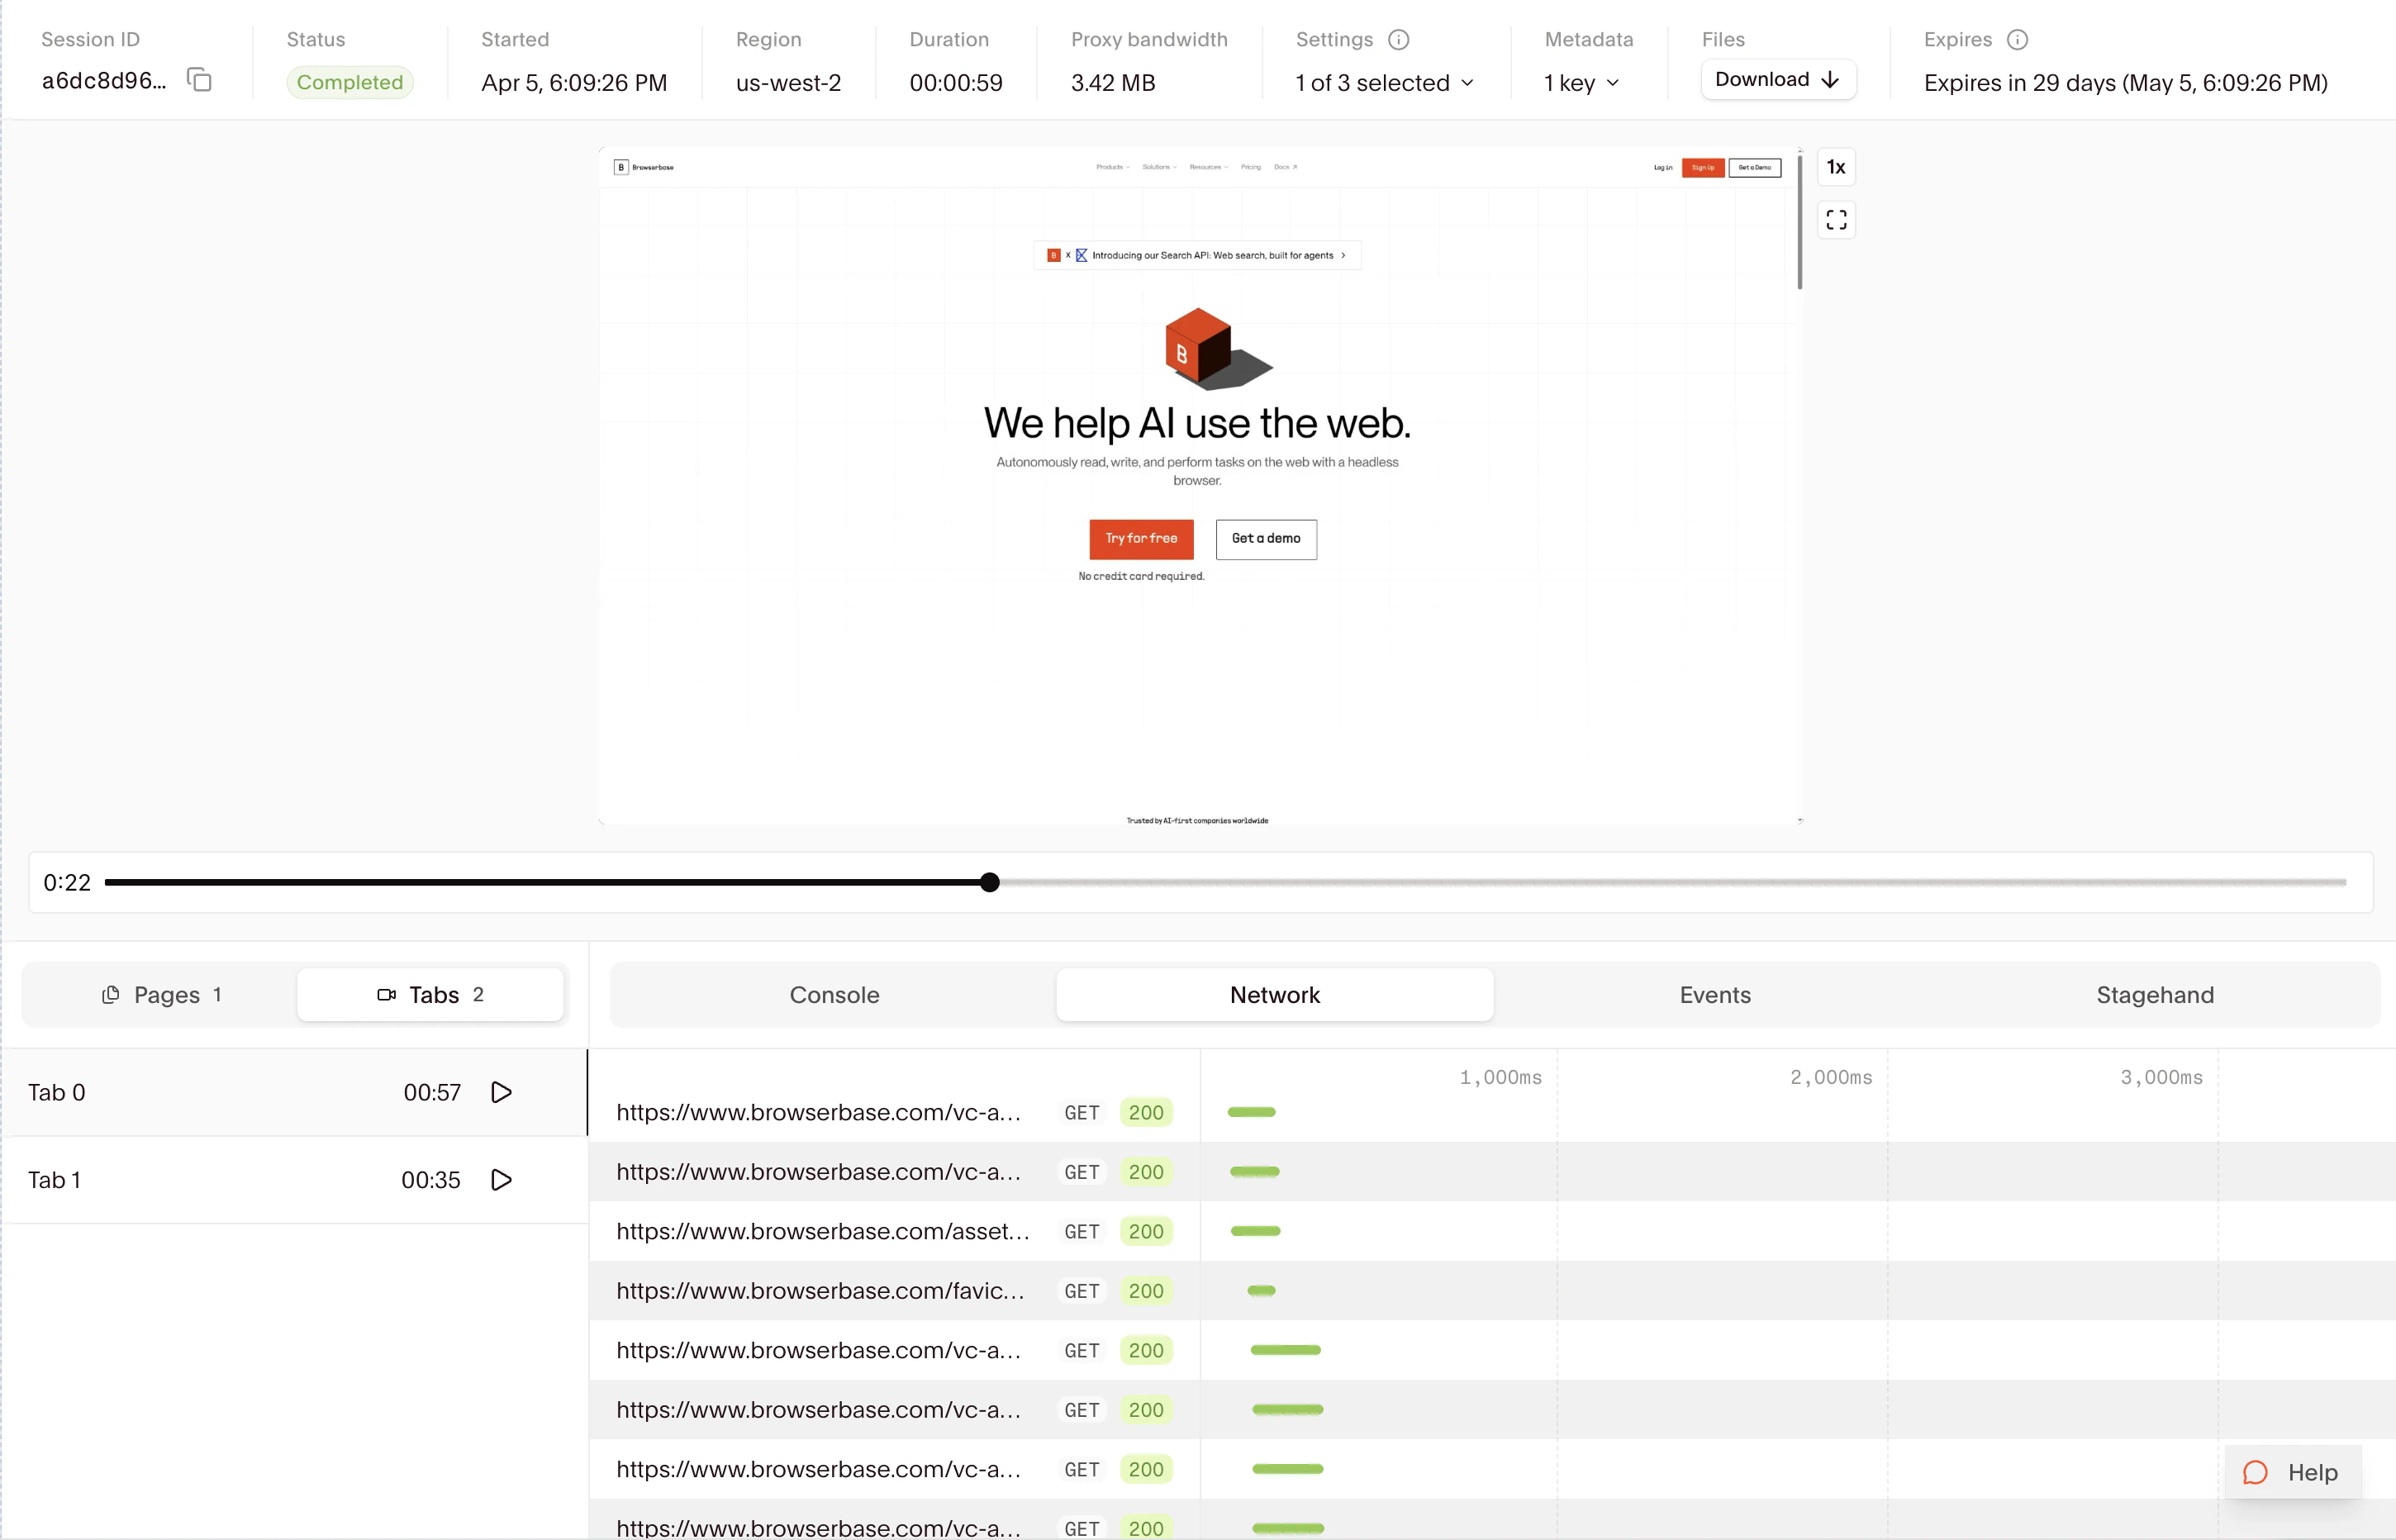 To embed playback in your own application, stream session replays as HLS through the Session Replay API.
### Live view
Debug running sessions in real-time using the Live Debug URL.
To embed playback in your own application, stream session replays as HLS through the Session Replay API.
### Live view
Debug running sessions in real-time using the Live Debug URL.
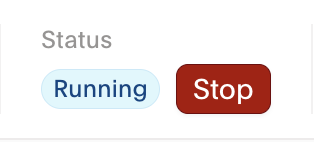
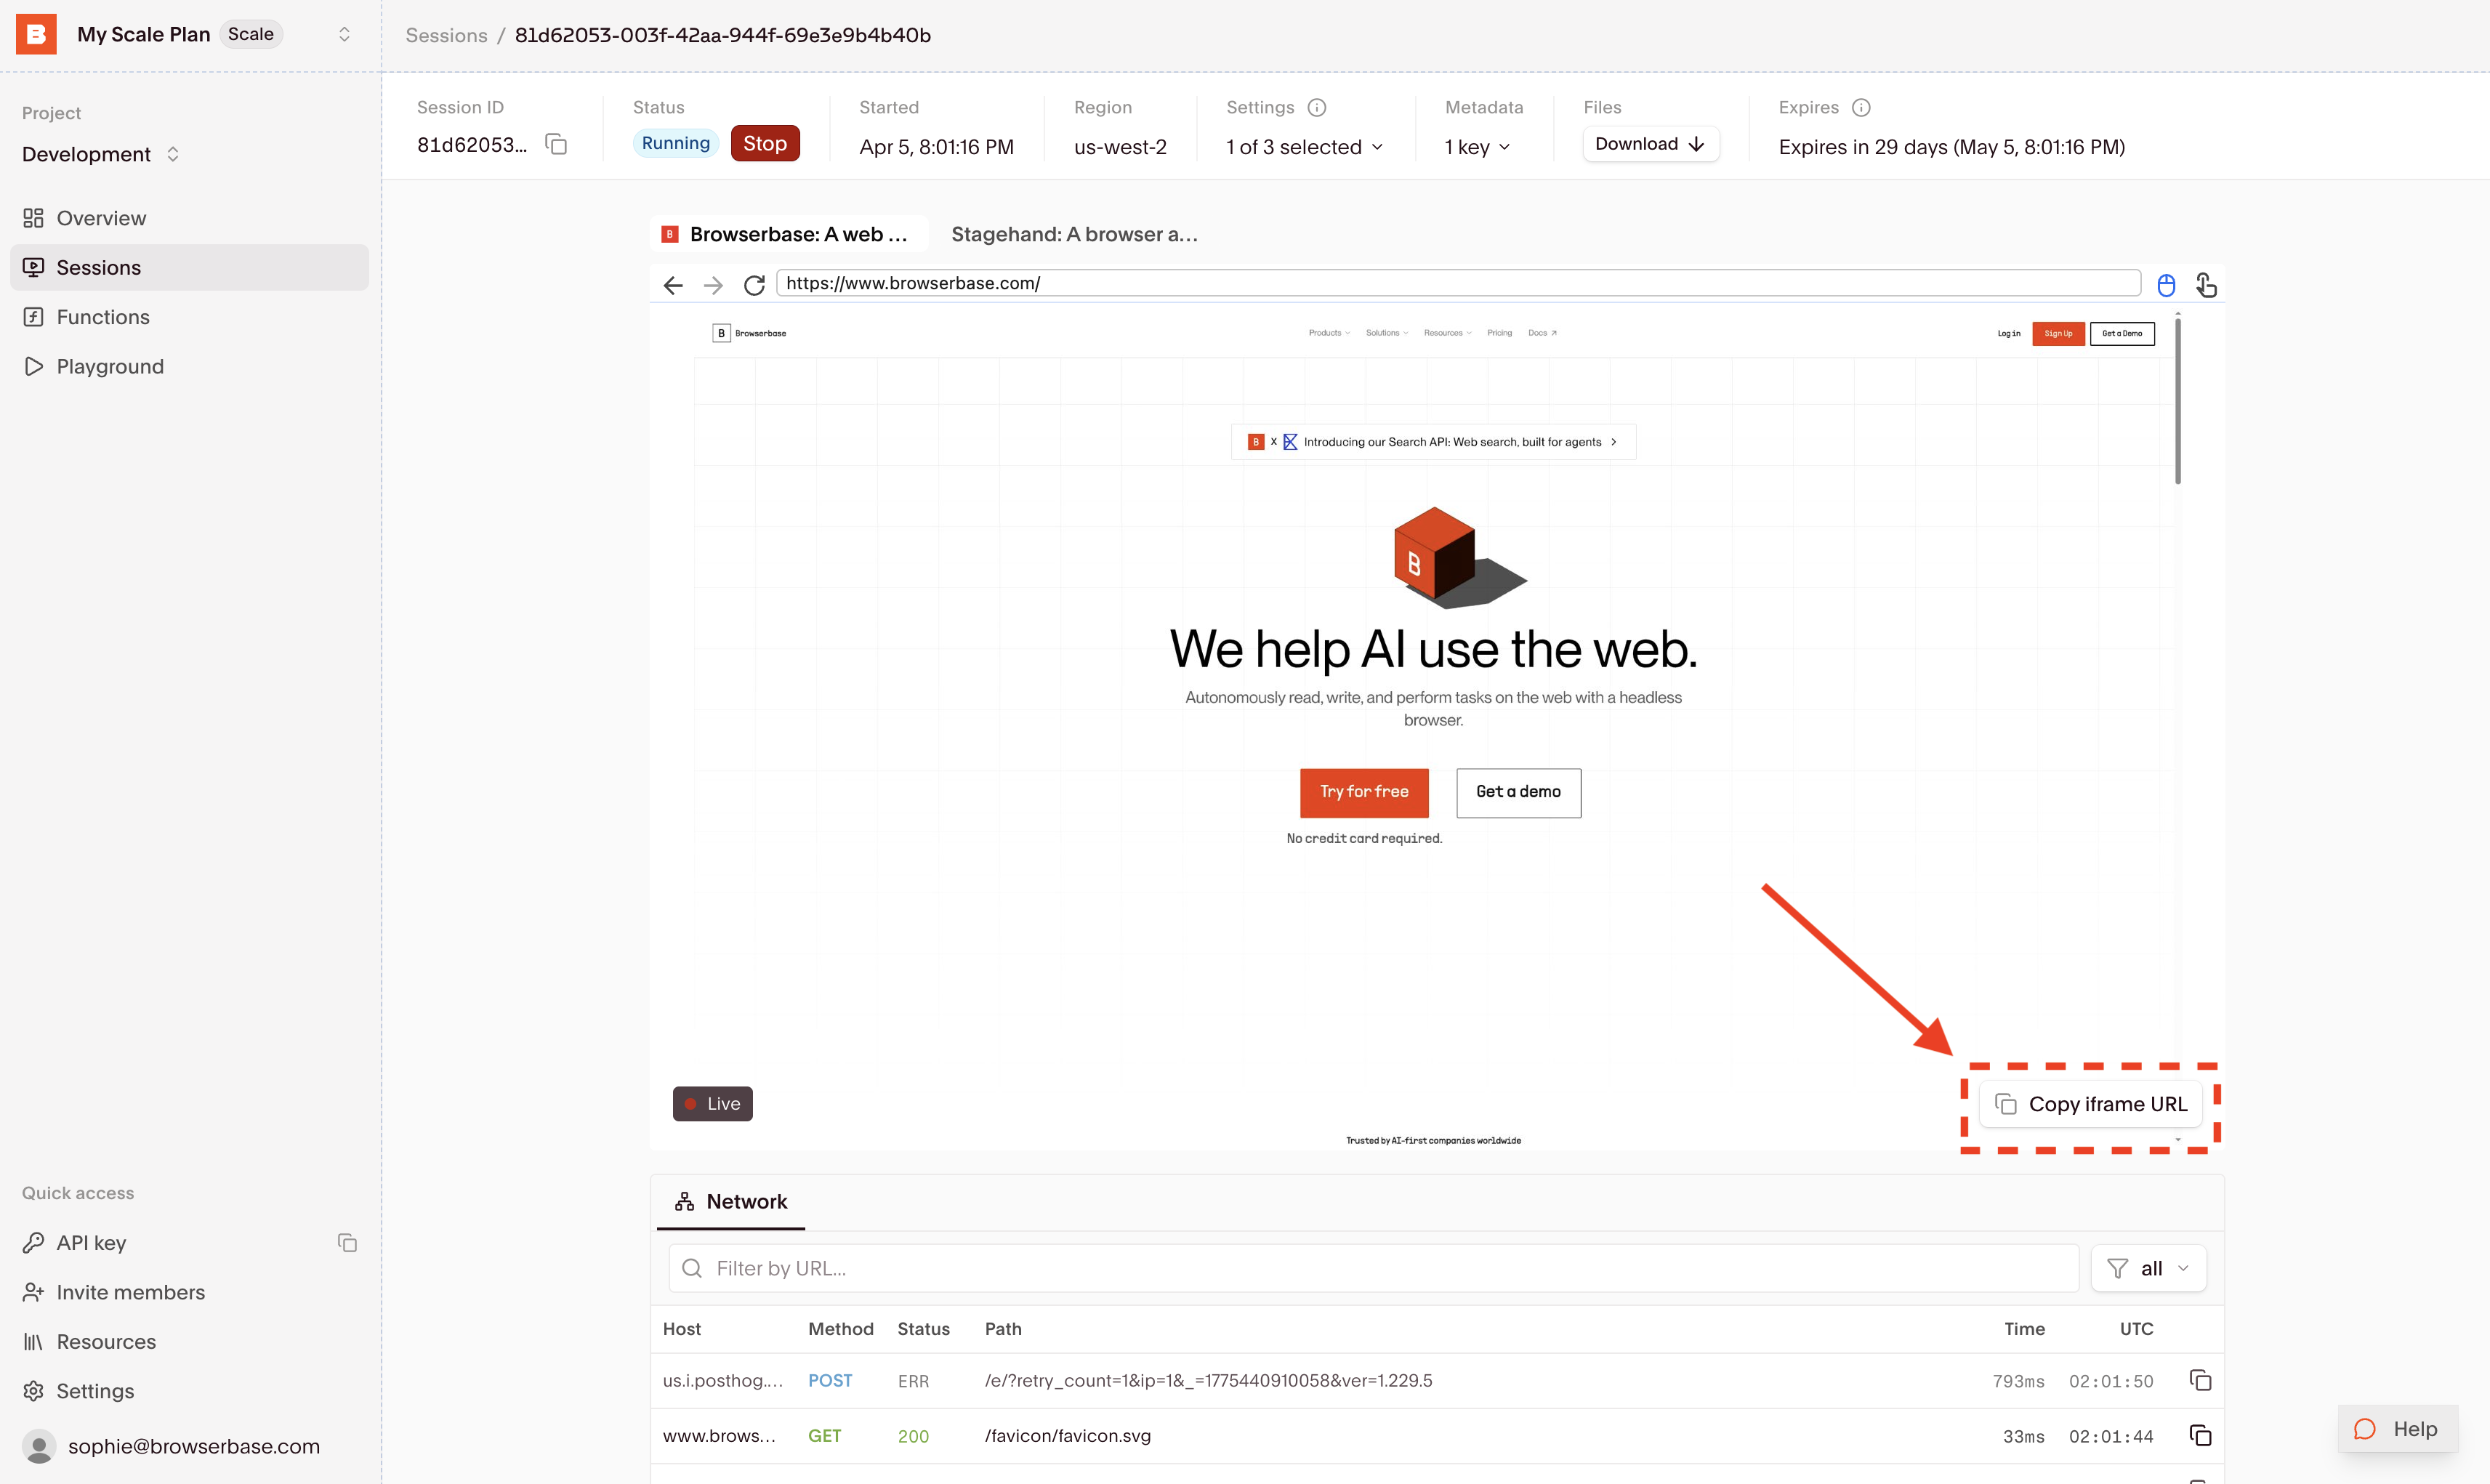 The `Copy Debug URL` button appears in the Session Inspector when a session is actively running.
 For more on Live View, see [Session Live View](/platform/browser/observability/session-live-view).
### Status bar
The Status Bar displays session metadata and status information.
For more on Live View, see [Session Live View](/platform/browser/observability/session-live-view).
### Status bar
The Status Bar displays session metadata and status information.
 | Property | Description |
| --------------------------------------------- | ----------------------------------------------------------------------------- |
| Session ID | Unique identifier for the session |
| Status | Current status and termination reason if applicable |
| Started | Session start timestamp |
| [Region](/optimizations/latency/multi-region) | Region where the session ran |
| Duration | Total session length |
| [Proxy Bandwidth](/platform/identity/proxies) | Data transferred through proxy (MB). Only displayed when proxies are enabled. |
| Settings | Session configuration (e.g., `keepAlive`, `context`) |
| User Metadata | Custom metadata attached to the session |
| Extension ID | Identifier for any browser extension used |
| Expires | When the session data expires and is deleted |
### Events and pages
The Events view shows a timeline of activity during the session.
| Property | Description |
| --------------------------------------------- | ----------------------------------------------------------------------------- |
| Session ID | Unique identifier for the session |
| Status | Current status and termination reason if applicable |
| Started | Session start timestamp |
| [Region](/optimizations/latency/multi-region) | Region where the session ran |
| Duration | Total session length |
| [Proxy Bandwidth](/platform/identity/proxies) | Data transferred through proxy (MB). Only displayed when proxies are enabled. |
| Settings | Session configuration (e.g., `keepAlive`, `context`) |
| User Metadata | Custom metadata attached to the session |
| Extension ID | Identifier for any browser extension used |
| Expires | When the session data expires and is deleted |
### Events and pages
The Events view shows a timeline of activity during the session.
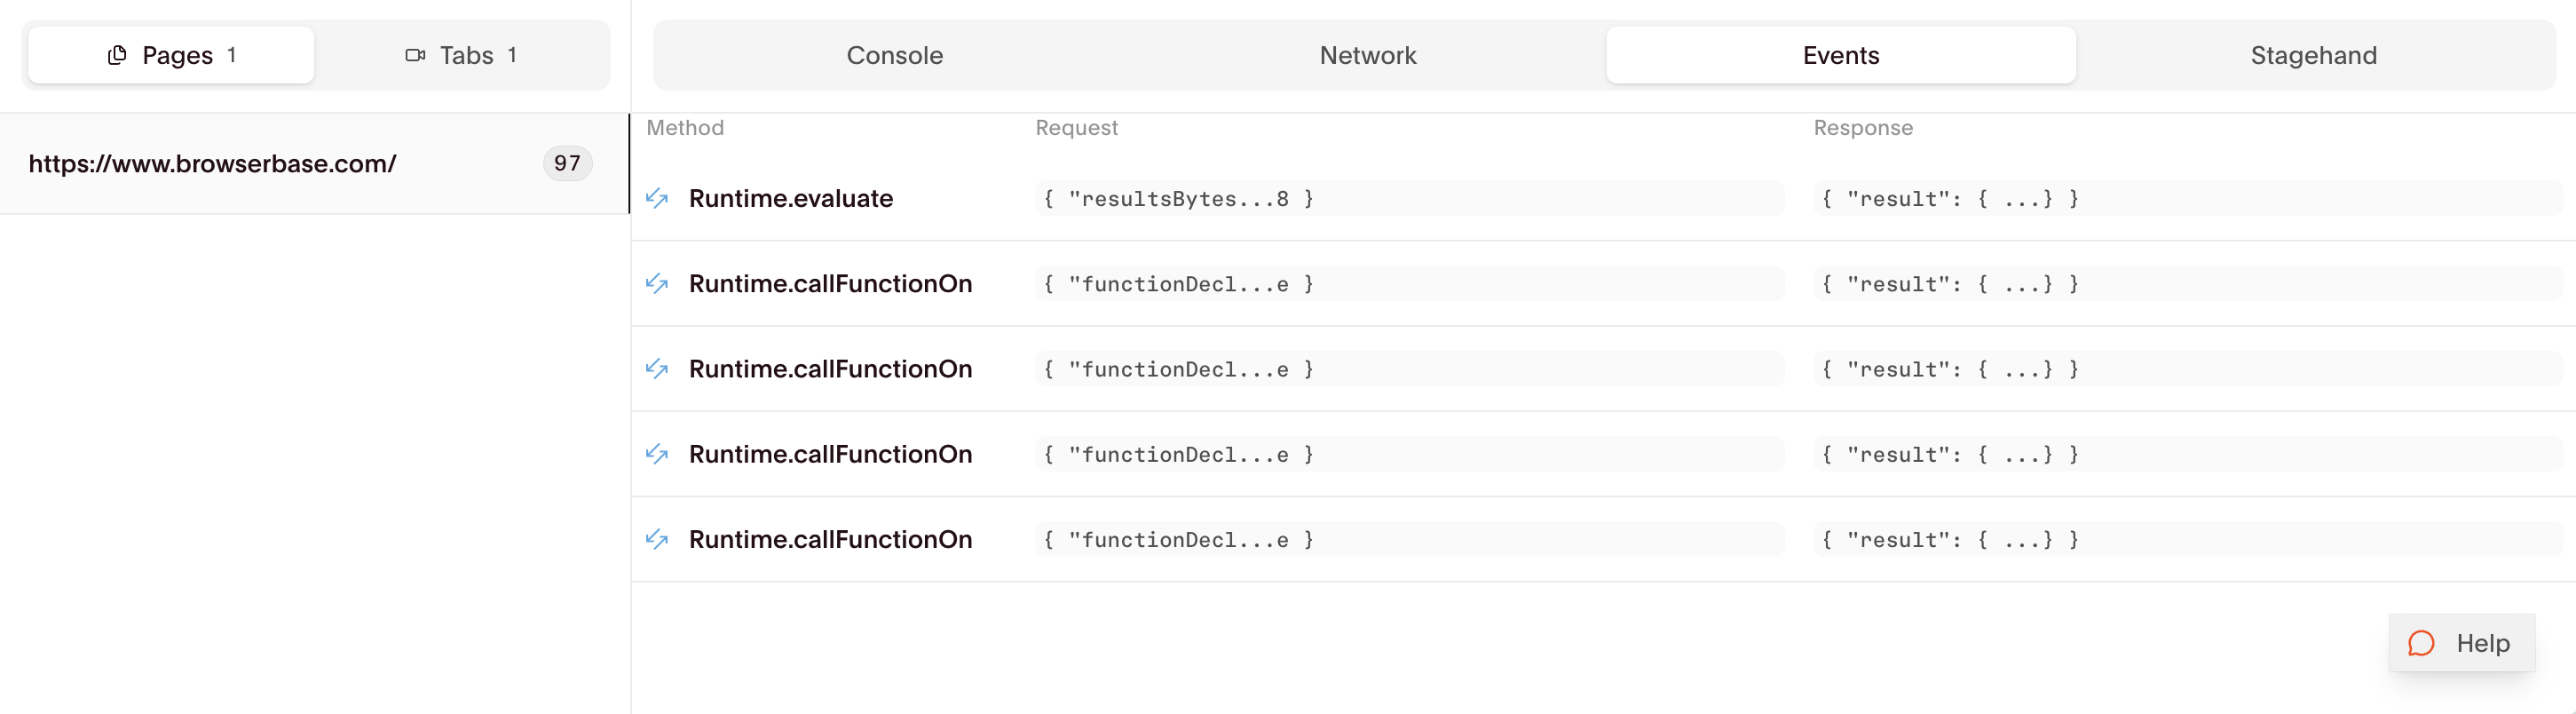 This view includes:
* Pages loaded during the session
* CDP events (`Runtime.*`, `Page.*`, `Input.*`, `Log.*`)
* Network requests and responses
### Stagehand
The Stagehand tab provides inspection tools for sessions created with [Stagehand](https://www.stagehand.dev/).
This view includes:
* Pages loaded during the session
* CDP events (`Runtime.*`, `Page.*`, `Input.*`, `Log.*`)
* Network requests and responses
### Stagehand
The Stagehand tab provides inspection tools for sessions created with [Stagehand](https://www.stagehand.dev/).
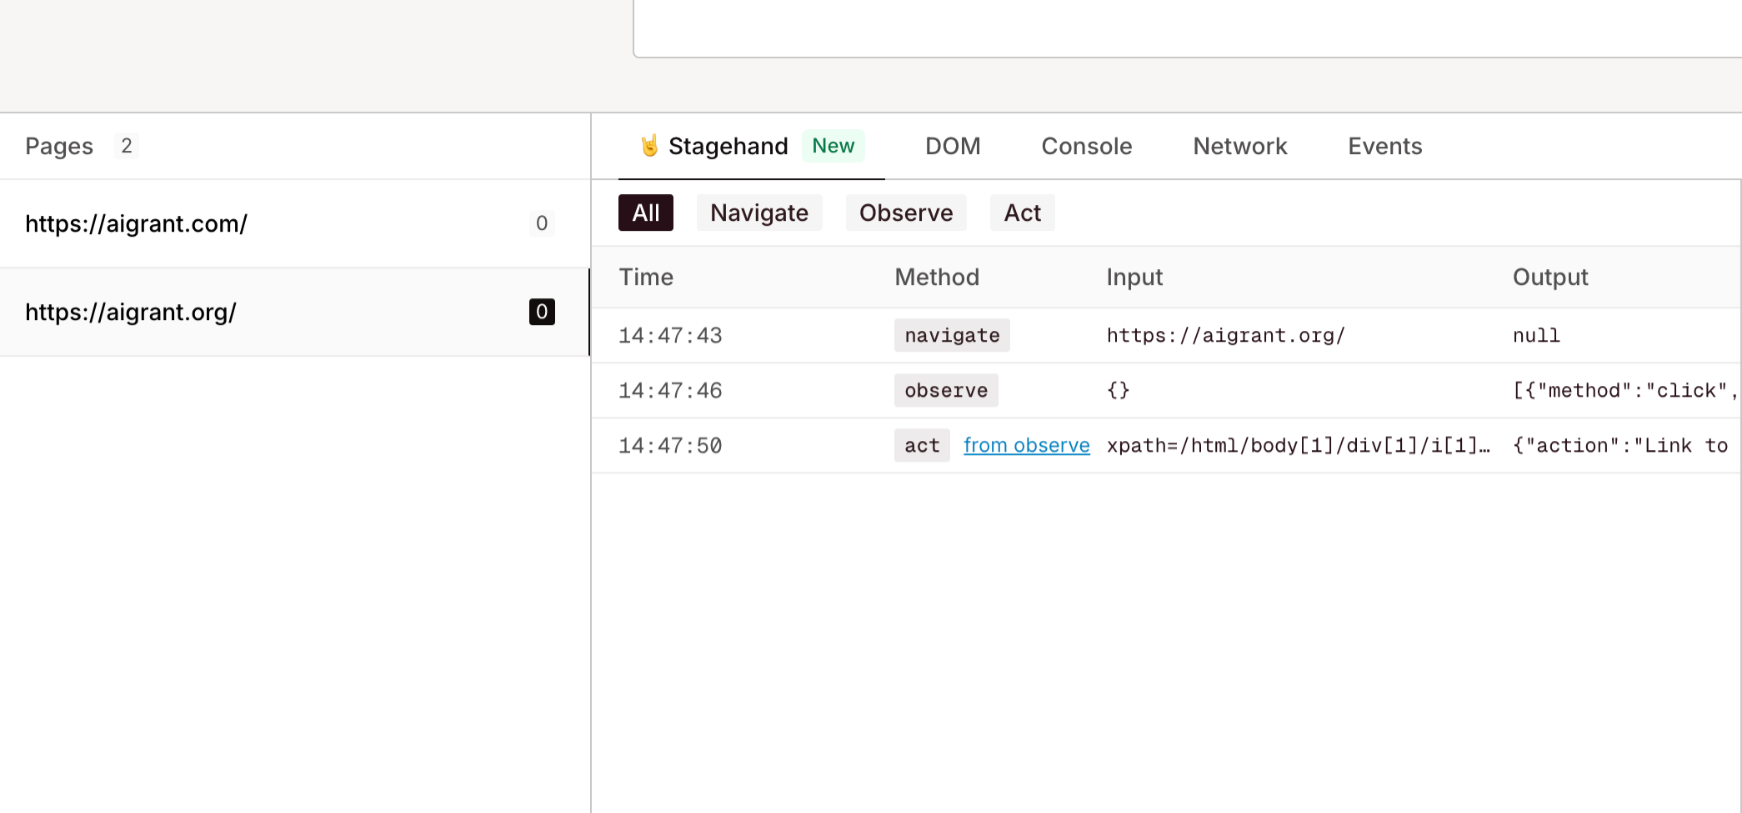 Click any row to expand details:
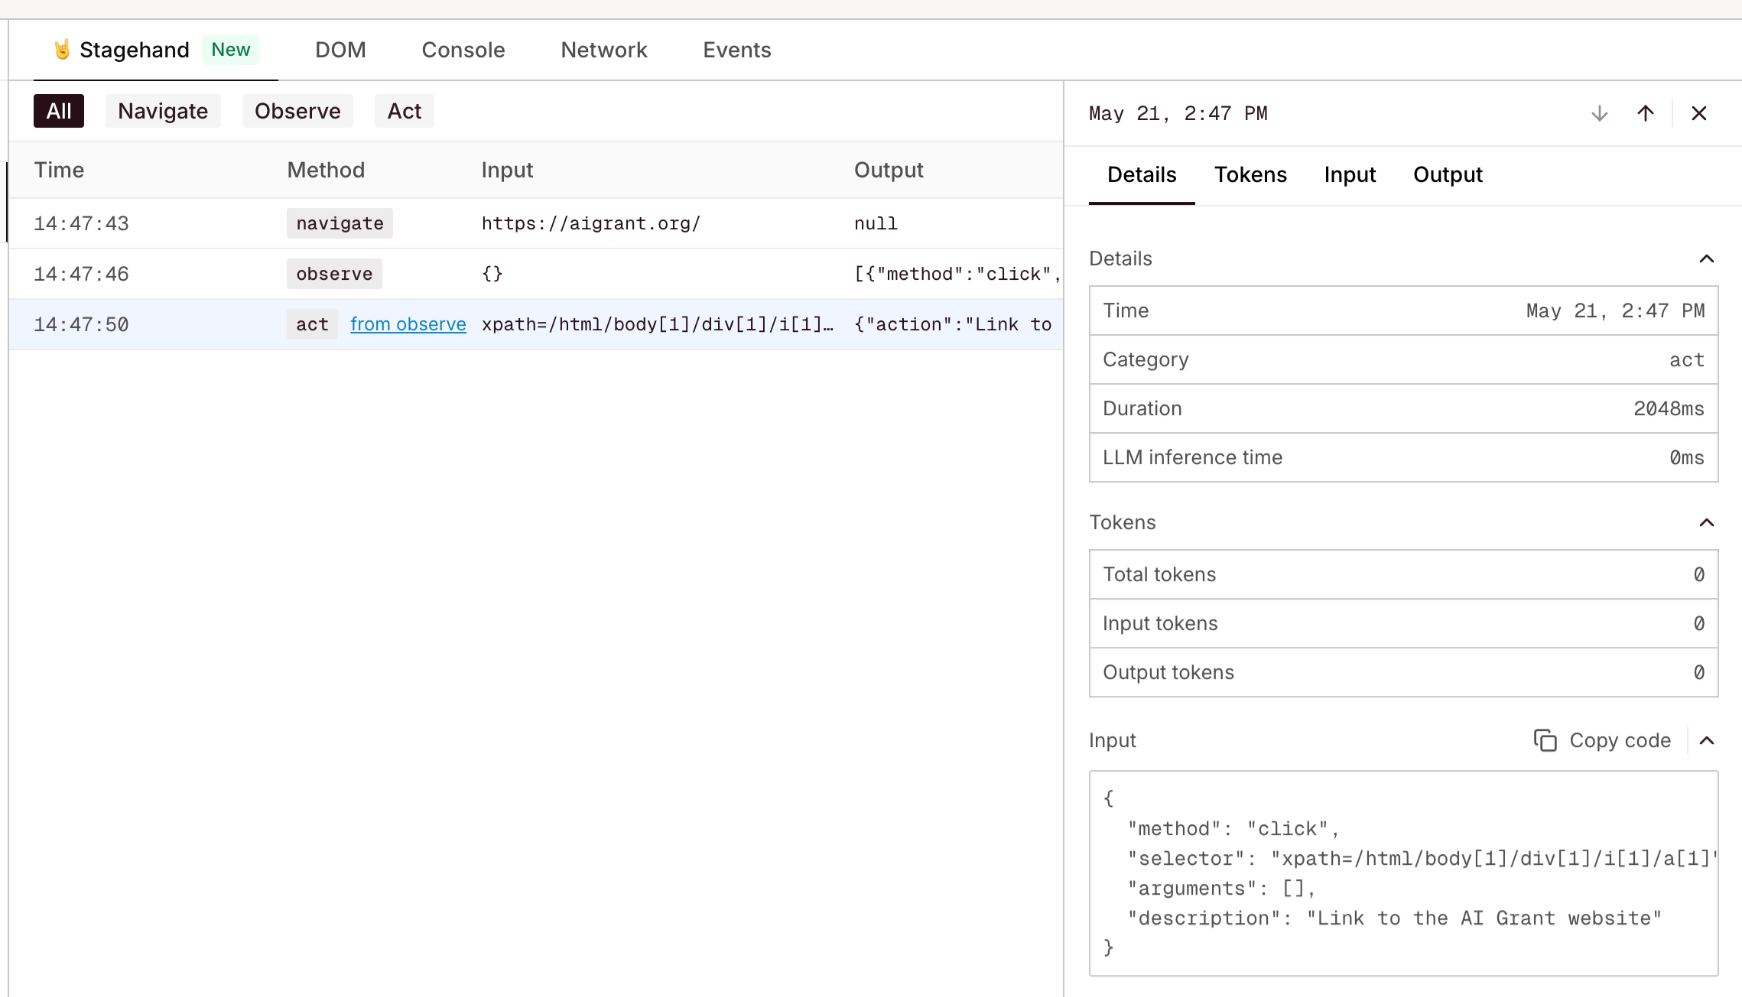 Available information:
* Token usage
* Execution time
* Extraction schemas
* Execution results
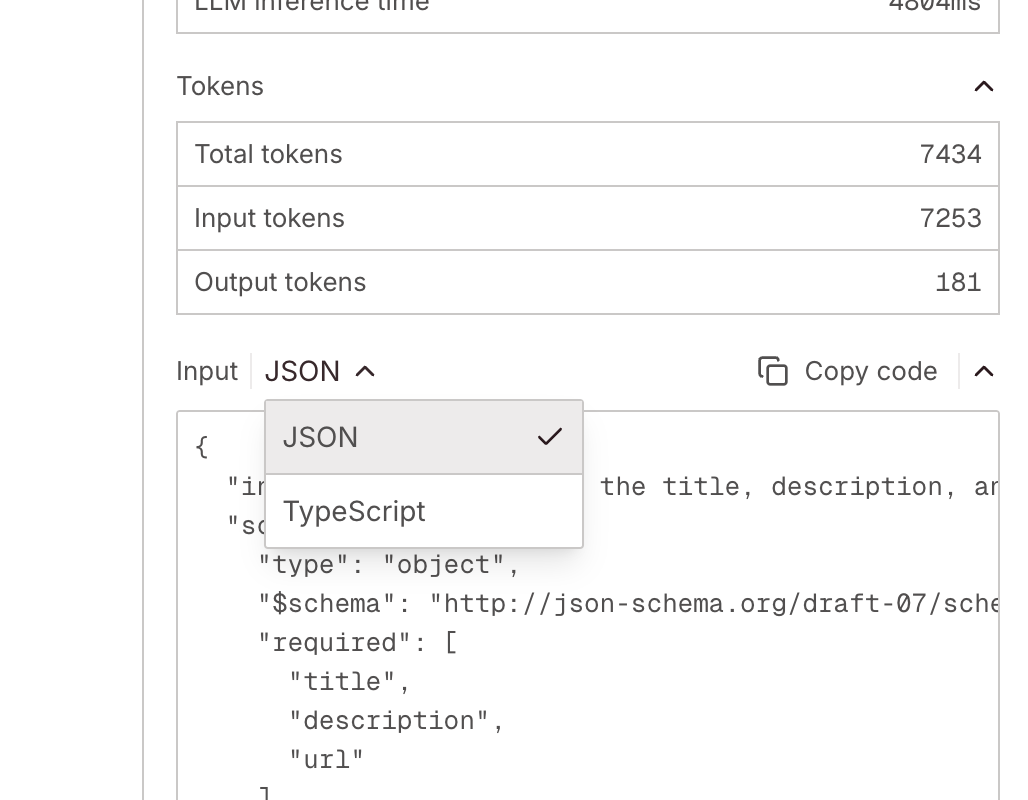
For `extract` calls, switch between JSON and [Zod](https://zod.dev/) schema formats:
Available information:
* Token usage
* Execution time
* Extraction schemas
* Execution results
For `extract` calls, switch between JSON and [Zod](https://zod.dev/) schema formats:
 ### Console logs
View browser console logs emitted by the [Web Console API](https://developer.mozilla.org/en-US/docs/Web/API/console) (`console.log()`, `console.error()`, etc.). These are logs generated by JavaScript running on the page.
### Console logs
View browser console logs emitted by the [Web Console API](https://developer.mozilla.org/en-US/docs/Web/API/console) (`console.log()`, `console.error()`, etc.). These are logs generated by JavaScript running on the page.
 Common console messages:
* `browser-solving-started` / `browser-solving-completed` - Captcha solving events
* `Starting recording` - Recording initialization
### Network logs
View all HTTP network requests and responses captured via Chrome DevTools Protocol ([`Network`](https://chromedevtools.github.io/devtools-protocol/tot/Network/) events).
Common console messages:
* `browser-solving-started` / `browser-solving-completed` - Captcha solving events
* `Starting recording` - Recording initialization
### Network logs
View all HTTP network requests and responses captured via Chrome DevTools Protocol ([`Network`](https://chromedevtools.github.io/devtools-protocol/tot/Network/) events).
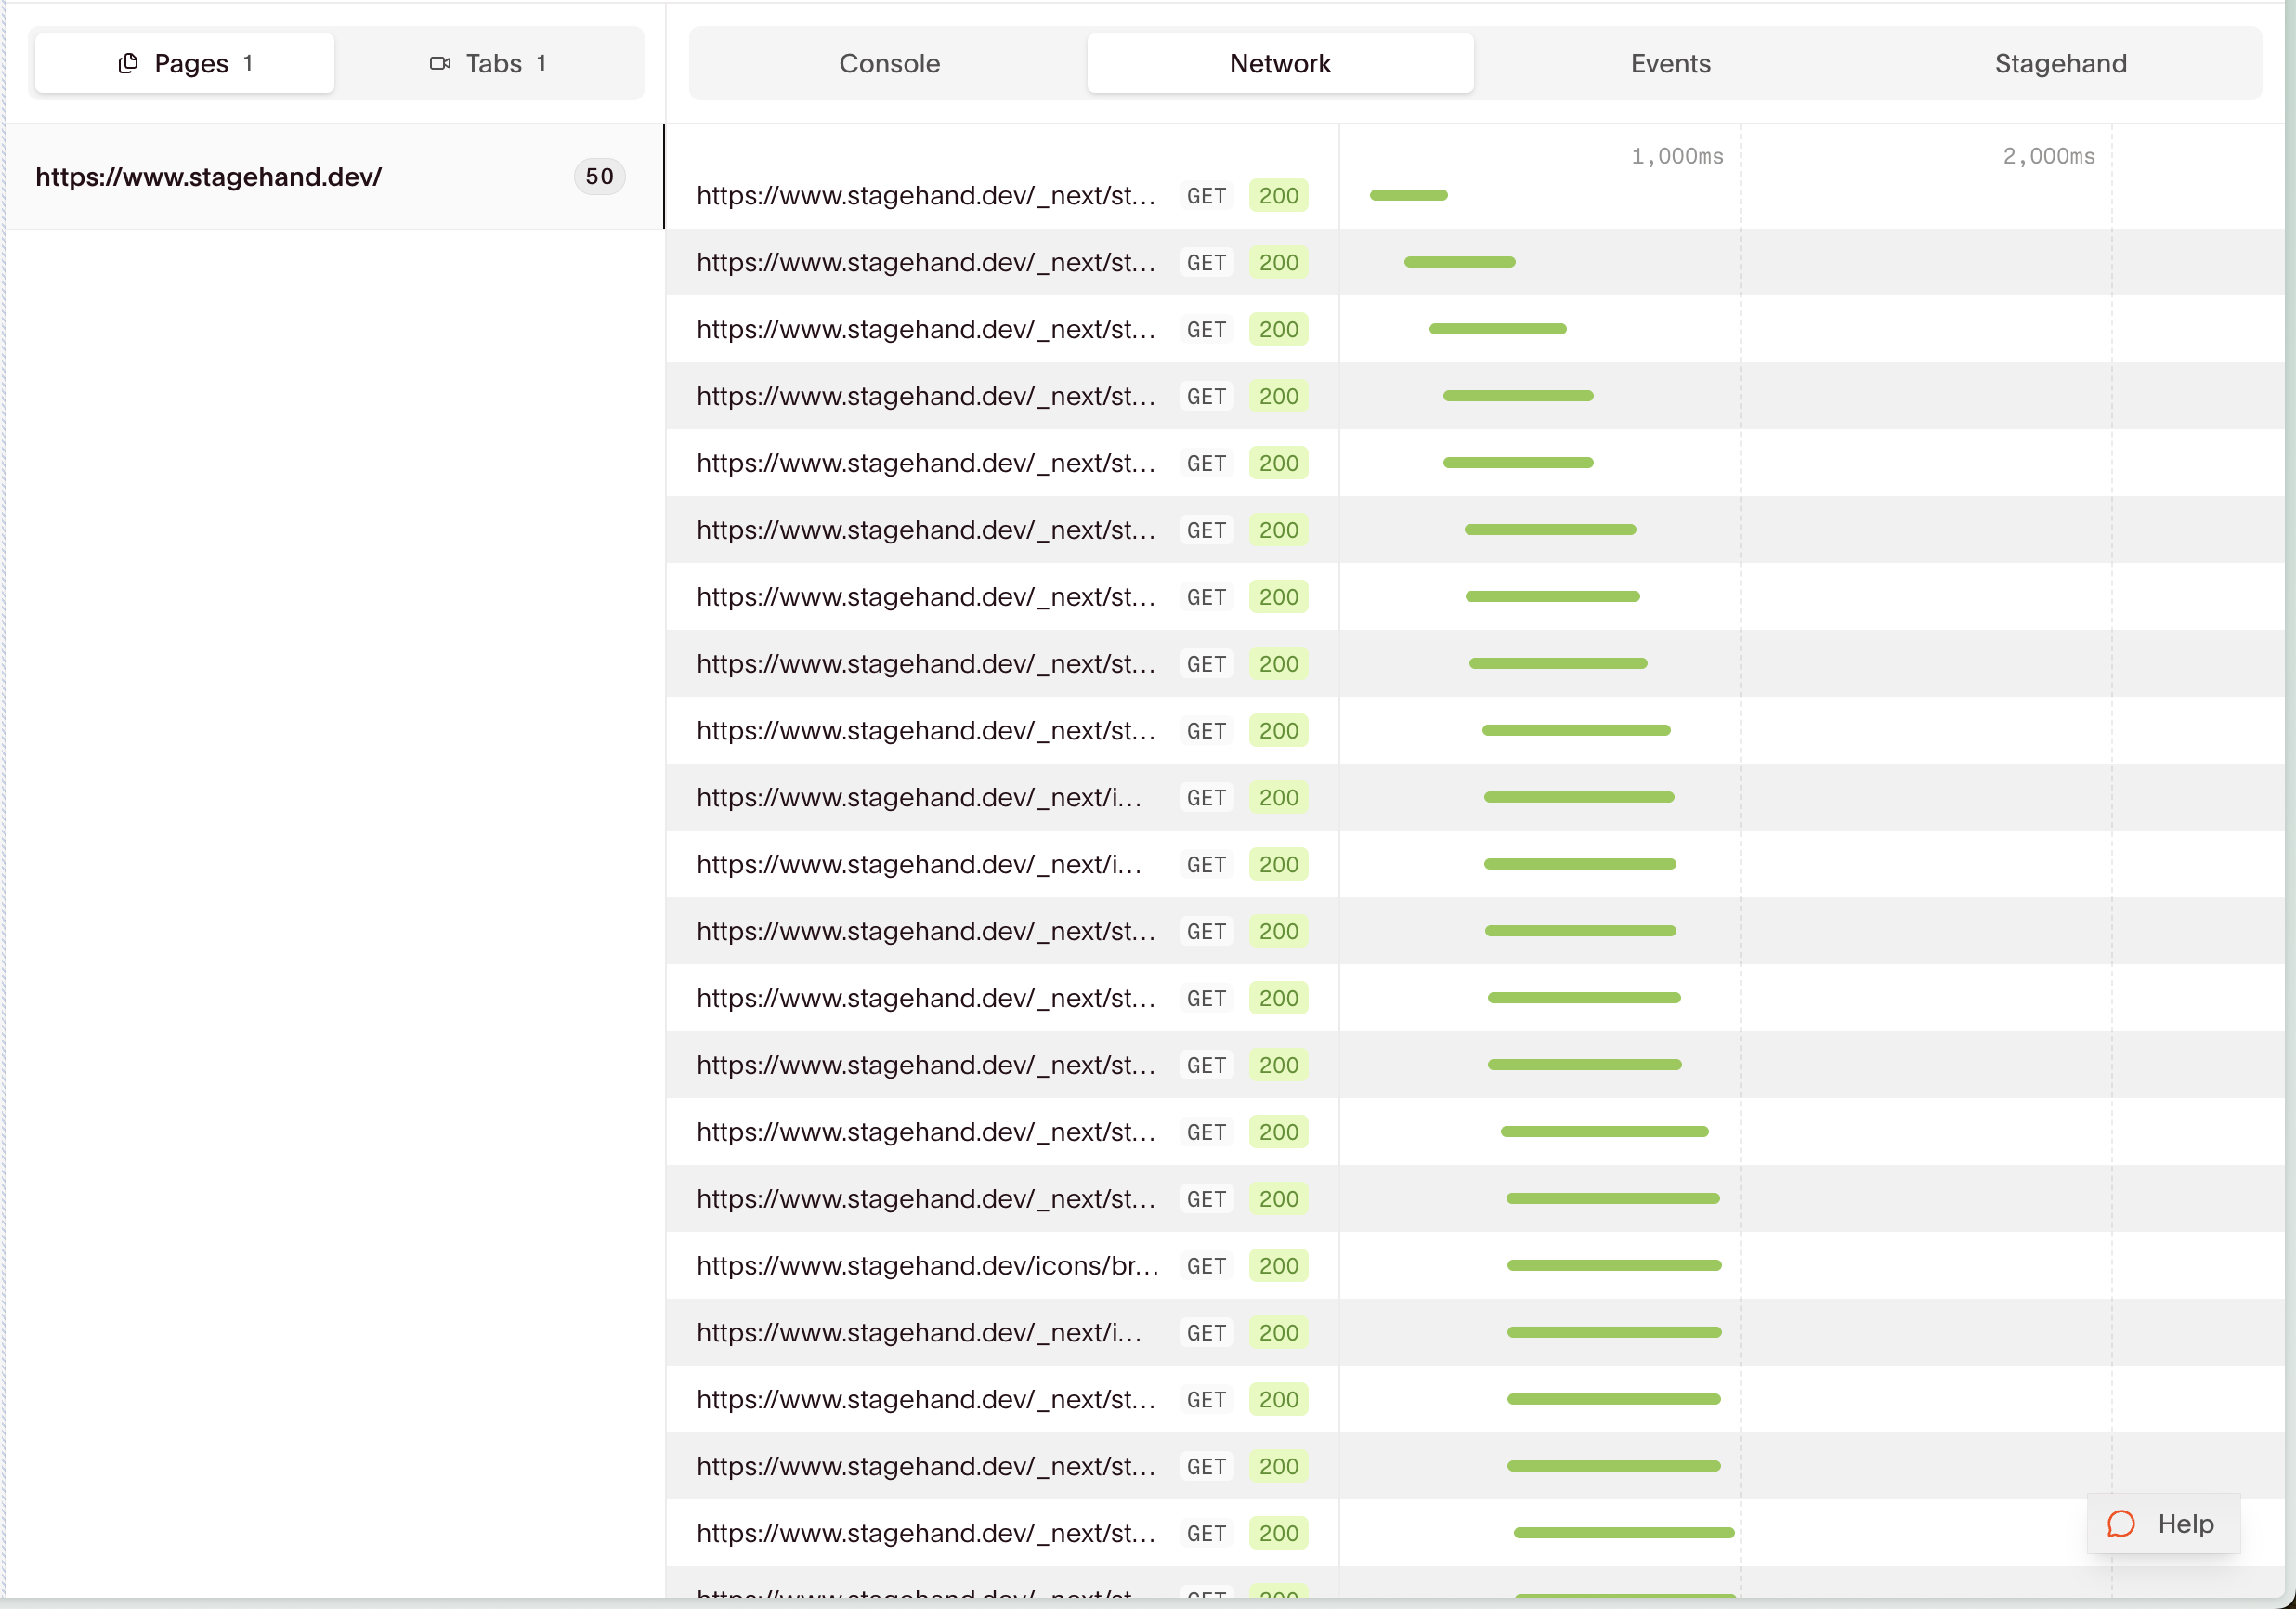 Use network logs to:
* Debug failed requests
* Analyze proxy bandwidth usage
* Identify slow or blocked resources
## Session logs API
Retrieve session logs programmatically for automated processing or custom tooling. The Session Logs API returns CDP (Chrome DevTools Protocol) events including console logs, network activity, and page lifecycle events.
```typescript theme={null}
import { Browserbase } from "@browserbasehq/sdk";
const bb = new Browserbase({ apiKey: process.env.BROWSERBASE_API_KEY! });
const logs = await bb.sessions.logs.list(sessionId);
console.log(logs);
```
```python theme={null}
from browserbase import Browserbase
import os
bb = Browserbase(api_key=os.environ["BROWSERBASE_API_KEY"])
logs = bb.sessions.logs.list(session_id)
print(logs)
```
```bash theme={null}
curl https://api.browserbase.com/v1/sessions//logs \
-H "X-BB-API-Key: $BROWSERBASE_API_KEY"
```
See [Sessions API](/reference/api/session-logs) for more details.
## HAR recording
HAR (HTTP Archive) files capture detailed network activity for offline analysis. Use Playwright's tracing feature to record HAR data locally.
```typescript theme={null}
import { Browserbase } from "@browserbasehq/sdk";
import { chromium } from "playwright-core";
const bb = new Browserbase({ apiKey: process.env.BROWSERBASE_API_KEY! });
const session = await bb.sessions.create();
const browser = await chromium.connectOverCDP(session.connectUrl);
const context = browser.contexts()[0];
const page = context.pages()[0];
// Start HAR recording
const harFile = `recording-${Date.now()}.har`;
await context.routeFromHAR(harFile, {
url: "**/*",
update: true,
updateContent: "embed",
updateMode: "full"
});
// Start tracing for local network capture
await context.tracing.start({
screenshots: true,
snapshots: true,
sources: true
});
await page.goto("https://news.ycombinator.com");
// Stop tracing and save
const traceFile = `trace-${Date.now()}.zip`;
await context.tracing.stop({ path: traceFile });
await page.close();
await browser.close();
console.log(`HAR: ${harFile}, Trace: ${traceFile}`);
```
```python theme={null}
from browserbase import Browserbase
from playwright.sync_api import sync_playwright
import os
import time
bb = Browserbase(api_key=os.environ["BROWSERBASE_API_KEY"])
session = bb.sessions.create()
with sync_playwright() as p:
browser = p.chromium.connect_over_cdp(session.connect_url)
context = browser.contexts[0]
page = context.pages[0]
# Start HAR recording
har_file = f"recording-{int(time.time())}.har"
context.route_from_har(har_file, url="**/*", update=True,
update_content="embed", update_mode="full")
# Start tracing for local network capture
context.tracing.start(screenshots=True, snapshots=True, sources=True)
page.goto("https://news.ycombinator.com")
# Stop tracing and save
trace_file = f"trace-{int(time.time())}.zip"
context.tracing.stop(path=trace_file)
page.close()
browser.close()
print(f"HAR: {har_file}, Trace: {trace_file}")
```
View trace files with: `npx playwright show-trace trace-file.zip`
HAR files created with `routeFromHAR` are stored on the remote instance. Use tracing to capture network data locally.
## Capturing browser console logs
You can capture browser console logs programmatically during your session using Playwright's console event listener. This gives you real-time access to `console.log()`, `console.error()`, and other Web Console API calls as they happen.
```typescript theme={null}
import { Browserbase } from "@browserbasehq/sdk";
import { chromium } from "playwright-core";
const bb = new Browserbase({ apiKey: process.env.BROWSERBASE_API_KEY! });
const session = await bb.sessions.create();
const browser = await chromium.connectOverCDP(session.connectUrl);
const context = browser.contexts()[0];
const page = context.pages()[0];
// Capture console logs
page.on("console", (msg) => {
console.log(`[${msg.type()}] ${msg.text()}`);
});
await page.goto("https://news.ycombinator.com");
await page.close();
await browser.close();
```
```python theme={null}
from browserbase import Browserbase
from playwright.sync_api import sync_playwright
import os
bb = Browserbase(api_key=os.environ["BROWSERBASE_API_KEY"])
session = bb.sessions.create()
with sync_playwright() as p:
browser = p.chromium.connect_over_cdp(session.connect_url)
context = browser.contexts[0]
page = context.pages[0]
# Capture console logs
page.on("console", lambda msg: print(f"[{msg.type}] {msg.text}"))
page.goto("https://news.ycombinator.com")
page.close()
browser.close()
```
## Debugging tips
| Issue | Solution |
| ------------------------------- | ------------------------------------------------------------------------------------------- |
| Session terminated unexpectedly | Check Status Bar for termination reason |
| Selector not found | Use DOM view to inspect element state at failure point |
| Network request failed | Check Network tab for status codes and response details |
| Bot protection issues | Review console logs for solving events, check [Agent Identity](/platform/identity/overview) |
Questions? Email [support@browserbase.com](mailto:support@browserbase.com)
Use network logs to:
* Debug failed requests
* Analyze proxy bandwidth usage
* Identify slow or blocked resources
## Session logs API
Retrieve session logs programmatically for automated processing or custom tooling. The Session Logs API returns CDP (Chrome DevTools Protocol) events including console logs, network activity, and page lifecycle events.
```typescript theme={null}
import { Browserbase } from "@browserbasehq/sdk";
const bb = new Browserbase({ apiKey: process.env.BROWSERBASE_API_KEY! });
const logs = await bb.sessions.logs.list(sessionId);
console.log(logs);
```
```python theme={null}
from browserbase import Browserbase
import os
bb = Browserbase(api_key=os.environ["BROWSERBASE_API_KEY"])
logs = bb.sessions.logs.list(session_id)
print(logs)
```
```bash theme={null}
curl https://api.browserbase.com/v1/sessions//logs \
-H "X-BB-API-Key: $BROWSERBASE_API_KEY"
```
See [Sessions API](/reference/api/session-logs) for more details.
## HAR recording
HAR (HTTP Archive) files capture detailed network activity for offline analysis. Use Playwright's tracing feature to record HAR data locally.
```typescript theme={null}
import { Browserbase } from "@browserbasehq/sdk";
import { chromium } from "playwright-core";
const bb = new Browserbase({ apiKey: process.env.BROWSERBASE_API_KEY! });
const session = await bb.sessions.create();
const browser = await chromium.connectOverCDP(session.connectUrl);
const context = browser.contexts()[0];
const page = context.pages()[0];
// Start HAR recording
const harFile = `recording-${Date.now()}.har`;
await context.routeFromHAR(harFile, {
url: "**/*",
update: true,
updateContent: "embed",
updateMode: "full"
});
// Start tracing for local network capture
await context.tracing.start({
screenshots: true,
snapshots: true,
sources: true
});
await page.goto("https://news.ycombinator.com");
// Stop tracing and save
const traceFile = `trace-${Date.now()}.zip`;
await context.tracing.stop({ path: traceFile });
await page.close();
await browser.close();
console.log(`HAR: ${harFile}, Trace: ${traceFile}`);
```
```python theme={null}
from browserbase import Browserbase
from playwright.sync_api import sync_playwright
import os
import time
bb = Browserbase(api_key=os.environ["BROWSERBASE_API_KEY"])
session = bb.sessions.create()
with sync_playwright() as p:
browser = p.chromium.connect_over_cdp(session.connect_url)
context = browser.contexts[0]
page = context.pages[0]
# Start HAR recording
har_file = f"recording-{int(time.time())}.har"
context.route_from_har(har_file, url="**/*", update=True,
update_content="embed", update_mode="full")
# Start tracing for local network capture
context.tracing.start(screenshots=True, snapshots=True, sources=True)
page.goto("https://news.ycombinator.com")
# Stop tracing and save
trace_file = f"trace-{int(time.time())}.zip"
context.tracing.stop(path=trace_file)
page.close()
browser.close()
print(f"HAR: {har_file}, Trace: {trace_file}")
```
View trace files with: `npx playwright show-trace trace-file.zip`
HAR files created with `routeFromHAR` are stored on the remote instance. Use tracing to capture network data locally.
## Capturing browser console logs
You can capture browser console logs programmatically during your session using Playwright's console event listener. This gives you real-time access to `console.log()`, `console.error()`, and other Web Console API calls as they happen.
```typescript theme={null}
import { Browserbase } from "@browserbasehq/sdk";
import { chromium } from "playwright-core";
const bb = new Browserbase({ apiKey: process.env.BROWSERBASE_API_KEY! });
const session = await bb.sessions.create();
const browser = await chromium.connectOverCDP(session.connectUrl);
const context = browser.contexts()[0];
const page = context.pages()[0];
// Capture console logs
page.on("console", (msg) => {
console.log(`[${msg.type()}] ${msg.text()}`);
});
await page.goto("https://news.ycombinator.com");
await page.close();
await browser.close();
```
```python theme={null}
from browserbase import Browserbase
from playwright.sync_api import sync_playwright
import os
bb = Browserbase(api_key=os.environ["BROWSERBASE_API_KEY"])
session = bb.sessions.create()
with sync_playwright() as p:
browser = p.chromium.connect_over_cdp(session.connect_url)
context = browser.contexts[0]
page = context.pages[0]
# Capture console logs
page.on("console", lambda msg: print(f"[{msg.type}] {msg.text}"))
page.goto("https://news.ycombinator.com")
page.close()
browser.close()
```
## Debugging tips
| Issue | Solution |
| ------------------------------- | ------------------------------------------------------------------------------------------- |
| Session terminated unexpectedly | Check Status Bar for termination reason |
| Selector not found | Use DOM view to inspect element state at failure point |
| Network request failed | Check Network tab for status codes and response details |
| Bot protection issues | Review console logs for solving events, check [Agent Identity](/platform/identity/overview) |
Questions? Email [support@browserbase.com](mailto:support@browserbase.com)